Description
- The Flyswatter2 is a high speed JTAG in-circuit debugger and programmer designed for ARM and MIPS target boards. It works with the open source software: OpenOCD (Open On-Chip Debugger). The Flyswatter2 provides a standard 20-pin ARM JTAG interface as well as a RS232 port that can be used to communicate with the target system.
The Flyswatter2 is based upon the FT2232H hi-speed (USB 2.0 – 480Mbit/s) dual USB UART/FIFO integrated circuit. The FT2232H has two devices integrated on it:
- PORT A: USB to JTAG interface.
- PORT B: USB to SERIAL UART.
Features:
- USB 2.0 Hi-Speed device (480 Mbits/sec) interface
- TCK frequency up to 30Mhz
- Supports adaptive clocking (RTCK support)
- 5 to 10 times faster than the original Flyswatter
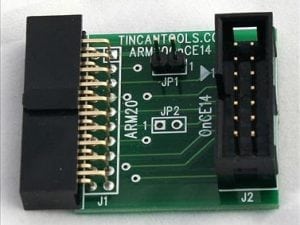
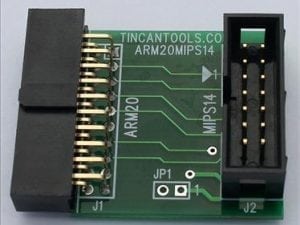
- Can be used to debug and program all ARM and MIPS processors supported by OpenOCD (MIPS processors require a JTAG adapter board)
- Provides a standard ARM 20-pin JTAG interface (2×10)
- Adds a virtual RS232 serial port to your computer or laptop with full modem signals: TXD, RXD, RTS, CTS, DTR, DSR, DCD, RI
- Supports target system voltages of: 5.0V, 3.3V, 2.5V, 1.8V, 1.6V (voltage range: 1.6V to 5.0V)
- No external power supply required – it is powered by the USB interface from the host computer
- Flash the bootloader, Linux kernel, and root file system onto embedded target systems
- Open software – supported by OpenOCD (open source) on-chip debugger
- Compact Size: 3.2 inches (width) x 2.7 inches (length) x 0.8 inches (height)
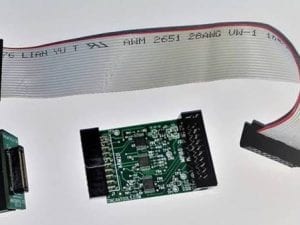
- Package Includes: Flyswatter2 debugger, USB Cable, 8 inch JTAG ribbon cable (20 pin – 2×10), 12 inch RS232 serial debug cable
- RoHS compliant
Serial UART
The Flyswatter2’s serial port provides a “USB to RS-232” serial device. The serial port is completely independent from the JTAG port. You can use the serial port by itself or use it together with the JTAG interface for debugging your target device.For Linux, the RS232 driver for the FT2232 is part of the main kernel tree and is provided in most standard Linux distributions. In Windows, you have to load the Windows driver for the FT2232. Once the driver is loaded, Windows will assign a virtual COM port to the Flyswatter’s serial port. It operates just like a standard COM port. You can add a serial port to laptops or PC’s that do not have a 9-pin legacy serial connector.
JTAG Interface
The Flyswatter2 provides a standard ARM-compatible 20-pin JTAG interface. The JTAG interface enables access to the on-chip debug module which is integrated into the ARM CPU. The debug module enables a programmer to debug the software on an embedded target system. The second purpose of the JTAG interface is to allow the programming of NOR and NAND FLASH memory devices that are connected to the target CPU.OpenOCD
OpenOCD (Open On-Chip Debugger) is open-source software that interfaces to the Flyswatter2’s JTAG port. OpenOCD provides debugging and in-system programming for embedded target devices. OpenOCD provides the ability to flash NAND and NOR FLASH memory devices on the target system. Flash programming is supported for external CFI compatible flashes.OpenOCD supports the following ARM cores:
- arm7tdmi (i.e. LPC2148, AT91SAM7)
- arm720t (i.e. LH79520, EP7312)
- arm9tdmi
- arm920t (i.e. S3C2410, S3C2440)
- arm922t
- arm926ejs (i.e. S3C2412, STN8811, STN8815)
- arm966e (i.e. STR91XF)
- arm11 (i.e. S3C6400, OMAP2420, MSM7200)
- arm1136
- arm1156
- arm1176
- cortex-m3 (i.e. LM3S series, STM32 series)
- cortex-a8 (i.e. OMAP3530 BeagleBoard)
- cortex-a8 (i.e. DM3730 BeagleBoard-xM)
- cortex-a9 (i.e. OMAP4430 PandaBoard)
- xscale (i.e. PXA255, PXA270, IXP42X)
- marvel feroceon cpu core
OpenOCD also supports the following MIPS cores:
- MIPS m4k, 24Kc, MIPS32
GDB Debugger
The Flyswatter2 can be used with the GDB (GNU Project debugger) open-source debugger. GDB allows you to see what is going on “inside” another program while it executes — or what another program was doing at the moment it crashed.
GDB can do four main kinds of things (plus other things in support of these) to help you catch bugs in the act:- Start your program, specifying anything that might affect its behavior.
- Make your program stop on specified conditions.
- Examine what has happened, when your program has stopped. (display registers, etc.)
- Change things in your program, so you can experiment with correcting the effects of one bug and go on to learn about another.
The program being debugged can be written in Ada, C, C++, Objective-C, Pascal (and many other languages). GDB can run on most popular Linux and Microsoft Windows variants.
Documents:
![]()